Writing a manuscript using {bookdown}: A short guide for the life sciences (Part I)
April 29, 2022
Why?
Let me start this post by sharing the reasons that lead me to write it. I have been an avid R user for some time now, and R has been my default option to clean, analyze, manipulate data, and create graphs. I started using {rmarkdown} to create reproducible reports for my analyses but it never occurred to me that I could write a complete paper with it. However, that changed a couple years ago I wrote a paper about generalized additive models for biomedical data using R. For that paper, I learned about {bookdown}, and how you could create books (or other long publication formats) with it. That was my first experience creating a paper using solely R, and I made many mistakes along the way (also learned a lot).
Specifically, it was hard for me to know how organize the document in a way that made things easier to track. Now, this organization issue probably wouldn’t had been a huge deal had I planned to only share the final paper, but back then I was starting to learn about Open Science and I decided that I had to make the whole project reproducible. By trial and error, I figured a way to structure the whole project in such a way that, if I wanted to recreate the whole paper, I only had to click the knit button once.
However, the next roadblock came when I worked in my final paper (as a PhD student) and I realized that probably one of the reasons why {bookdown} is not used more frequently by people in life sciences is because we deal with biological data and images. What I mean by this is that many people know about {rmarkdown}, {bookdown}, and other R packages are good for writing documents; however, these packages are typically associated with documents that are only composed of text and R-generated figures. But when you have imaging data and files (e.g., microscopy images, pictures of equipment, etc), you want to be able to create figures using those files and the first impression is that you can’t do that with {bookdown}. However, as I discovered, you can add imaging data to a document made with {bookdown}! Combining this fact and packages such as {patchwork} and good ’ole {ggplot2} it turns out you can compose great figures that combine statistical analyses, imaging data and more, and you can create a paper that is reproducible with one click. How neat is that?
Purpose of this post
Based on the experiences I have described before, and the fact that there don’t seem to be much resources on how to use {bookdown} to create reproducible papers in the life sciences (biology, biomedical research, etc.), I wanted to write a short guide that others could use to switch from Word (or Google Docs) to {bookdown} to write manuscripts.
Now, the obliged disclaimer: I am sharing what I have found that works for me. It might be the case that some of the things I describe are not applicable in some situations. But I am sure that with some experimentation, you can tailor the tools I talk about here for your own needs!
Is it worth it?
I realize that someone might say: Why should I change the way I write my papers? Why can’t I just keep using Word?
Well, let me try to answer with another question: Why are you using Word? Is it because is the best tool you can use or is it because is the same tool you have been using over and over?. The truth is that most of us working in the most of the STEM fields (Physics and Math being the general exception) stick with writing tools that we learned back in high school (which is when you typically learn to do some acceptable documents in Word).
But as it turns out, those tools are not the best to create documents that can be easily reproduced (opening PC-created Word documents in a Mac, anyone?). And I don’t think I have to convince anyone when I say that for formatting, Word sucks. Have you ever tried to move a figure a couple of millimeters in a document that you have painstakingly formatted? If so, your reaction was probably this:

One of the main benefits of using writing tools like {bookdown} is that, on a basic level, you don’t have to mess with document formatting because this will be automatically handled by the computer. Of course, the learning curve is steeper when switching from Word because your document organization will become programatic, and the first time you do it you will probably miss the blank page-menu-ruler-font tools environment from Word, but trust me when I say that as you progress, you won’t miss these tools anymore because the formatting aspects they handle will be programatically handled in your document by {bookdown}. Additionally, you will always create documents that look good (either PDF or HTML) and if you even want to, you can create a Word output if you want to share your document with someone that is more familiar with that format! (But as always, there are some minor formatting issues…)
Now, eventually you might want to learn \(\LaTeX\) to customize your document, add fancy stuff and be able to debug some issues that come with complex documents, but as a start knowing the basics is enough and will simplify the way you do things.
What we will learn
I will divide this guide in five areas:
- How to organize the project
- Document structure
- Creating figures I
- Creating figures II
- Managing references
Each area will cover an aspect of the process of building a paper that is reproducible and that can be created using R. If I decide that there is something else I need to add, I certainly will add more areas to the list.
What you need
Here are the prerequisites to understand (and apply) this guide:
- Install RStudio and R (this last link has instructions to install both)
- Be familiar with R syntax, specifically with {ggplot2} and {patchwork}
- Install {bookdown} (instructions can be found here)
- Install a \(\LaTeX\) distribution (for PDF): I recommend using TinyTex
Don’t feel overwhelmed by the steps above, because they don’t take THAT long to complete, and once you’re done, you’re all set! Also, keep in mind that beyond those prerequisites I make no further assumptions, meaning that I will try to explain each step as clearly as possible. Having said that, let’s start the guide! In this post I will cover Project Organization.
Part 1
How to organize the project
The first thing you want to do is to create a Project for your paper. This will make things easier to navigate, and will save you a lot of trouble later on. Projects are a neat option of RStudio, which is why you needed to install the IDE before starting the guide. To create the project, you need to open RStudio and go to File → New Project → New Directory → New Project. Choose a directory name and the location where you want the project to be (Documents, Desktop, etc.). In this post I won’t cover how to do a project using version control, so ignore the “Create git repository”, and “Use renv with this project” options. Once you have named your project, select “Open in new session” and click Create Project.
The main advantage of a Project for a paper is that it allows you to store all your files and run your scripts in the same directory, which is called every time you open the Project. This avoids confusion as you add more files to your paper, and saves you the time required to “Set a working directory”.
How to structure your project?
Once you click “Create Project” you’ll notice that a new session opens and that in the Files panel in RStudio you now have something that looks like this:

There is nothing else in your project, just a project file (.Rproj) which contains the Project options. Now, the first thing you want to do is to create the directories that will contain the parts of your work. From my experience, is best to “keep things apart”.
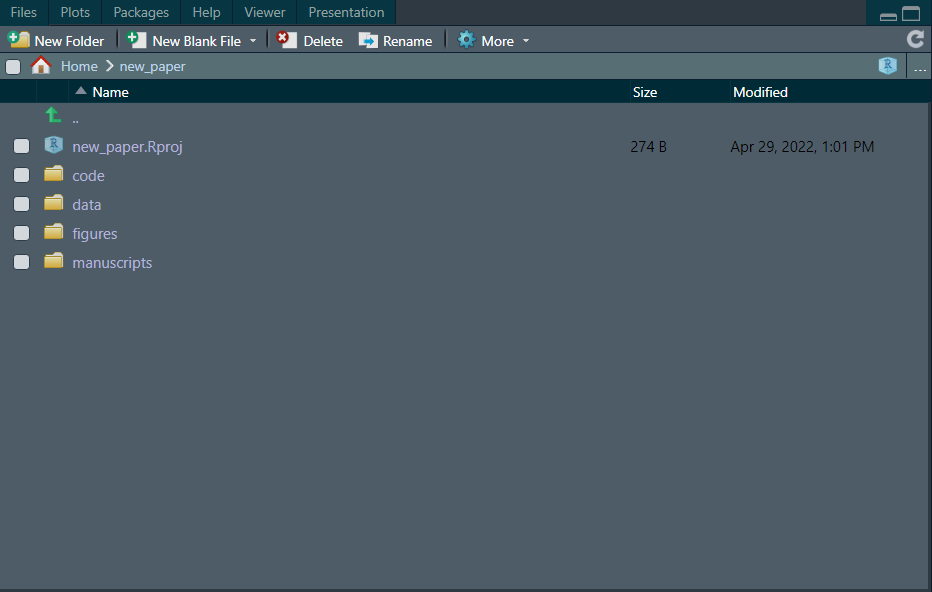
What I mean by “keeping things apart” is that you create directories for the different components of the paper; for a project that will combine some work in R for statistical analysis (and therefore, some R scripts) and microscopy or other type of imaging data a project could contain the following directories:
- code: Here you can store all your scripts, either in the directory itself or in another subdirectory
- data: Stores the raw csv files that you call in your scripts for cleaning, data manipulation and analysis
- figures: Imaging data, as well as schematics and/or diagrams
- manuscripts: Here you can store successive iterations of your paper as you make corrections.
If you create these folders, your project will look like this:
The rationale for the different directories is that typically, what tends to change (sometimes a lot) is the written part of the manuscript itself, but the data and the statistical analyses are usually iterated a few times and after that, they just need to be incorporated into the manuscript. The same idea holds for the “figures” directory, where you create the figures (this can be in a different environment such as Inkscape, BioRender, etc. ) and later on you only need to incorporate them into the manuscript.
Let’s assume an scenario where you have completed your data analyses and figures, and have some scripts in “code” that use the csv files in the “data” directory. Now you are ready to start writing your manuscript. The way I have found that this work best is to create a directory within “manuscripts” that you can call “paper_v1”. You finish this first draft and send it for internal review (your advisor in the case of a grad student, collaborators, etc.). You get some feedback and decide you want to start v2 of the paper.
Here is where the advantage of “keeping this apart” apparent, because all you need to do is create another directory within “manuscripts” for the second draft (let’s assume this directory is called “paper_v2”), and modify the written part of the manuscript. The neat thing here is that your code and data stay in the same directories and they just need to be called again (I will talk in detail about this later on), there is no need of re-writring scripts and moving files with code and data over and over again!

Summing it up
In this first post, I covered the benefits of using {bookdown} to create reproducible (academic) papers, and how “keeping this apart” by creating directories for your data, code and manuscript files makes thing easier to follow. In the next post, I will cover how to structure the paper itself! See ya!
- Posted on:
- April 29, 2022
- Length:
- 9 minute read, 1818 words
- See Also: